

Price Gregory has spent decades running large-diameter pipeline and utility projects, but on a 30-mile job, one missed weld count or station discrepancy can throw off the progress numbers behind a multimillion-dollar bill. Tracking that data has moved beyond a spreadsheet with a tab for every day to the need for one connected platform that keeps field and office numbers in sync.
Closing the Gap Between the Field and the Office
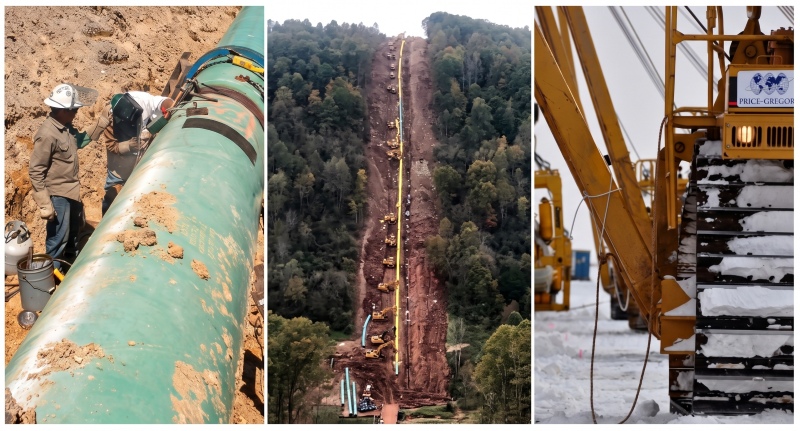
For almost 14 years, Jean Crush has watched Price Gregory International grow from a company that ran on paper time cards and a single massive spreadsheet into a heavy civil contractor building large-diameter pipeline, gas distribution, and data center projects across multiple states. As Director of Information Systems, she has led much of that transition herself, and her team’s story is really a story about closing the gap between what happens on the job site every day and what leadership and clients need to see.
Just because you've done it for fifteen years this way, with all the technology we have, that doesn't mean that it's the best way now.
— Jean Crush, Director of Information Systems, Price Gregory
The Issue: A Spreadsheet That Couldn’t Keep Up
For decades, Price Gregory’s operations team tracked daily progress the way a lot of contractors do: in Excel. But this wasn’t a simple tracker. On a six-month pipeline job, the spreadsheet would get a new tab for every single day, each one carrying forward the previous day’s totals through a macro.
That structure had a serious flaw. If a foreman’s paper time card revealed an error from two or three weeks back, correcting that one tab did nothing for the running total. As Crush put it, going back to fix an earlier day “wouldn’t do any value… it wouldn’t carry forward on a job-to-date basis.” The spreadsheet simply wasn’t built like a database, so job-to-date numbers could quietly drift out of sync with what actually happened in the field.
On top of that, the data itself was getting more complex. Price Gregory’s pipeline crews weren’t just tracking linear feet. They needed weld counts by diameter, milepost station markers, and rental tracking on the equipment mats crews use to keep heavy machinery out of the mud. None of that fit neatly into a simple linear-foot or dollar metric, and clients were asking for faster, more detailed progress updates than a monthly spreadsheet rebuild could deliver.
The Solution: One Platform Built to Flex With the Job
Price Gregory’s answer was to move a 30-mile pipeline project onto HeavyJob Web and put iPads directly in foremen’s hands. That shift did more than digitize paper time cards. It gave the team a real database to build on, so a correction made today actually flows through the job-to-date totals instead of getting stuck in a spreadsheet tab.
The real flexibility came from HeavyJob’s cost code tags. Crush’s team set up tags at two levels: company-wide tags for things that apply across every job, like rain-out days and mat deliveries, and job-specific tags for details unique to a particular pipeline, like specific weld diameters. Foremen use those tags to record weld types, milepost start and stop stations, and mat rental pickups directly on their tablets in the field.
From there, HeavyJob data flows into Price Gregory’s own Power BI environment through Direct Access, a connection that pulls HeavyJob data straight into the company’s database on a regular refresh. That gave Crush room to build dashboards well beyond what a flat spreadsheet or standard report could offer, including daily progress views the team can turn into client-facing PDFs.
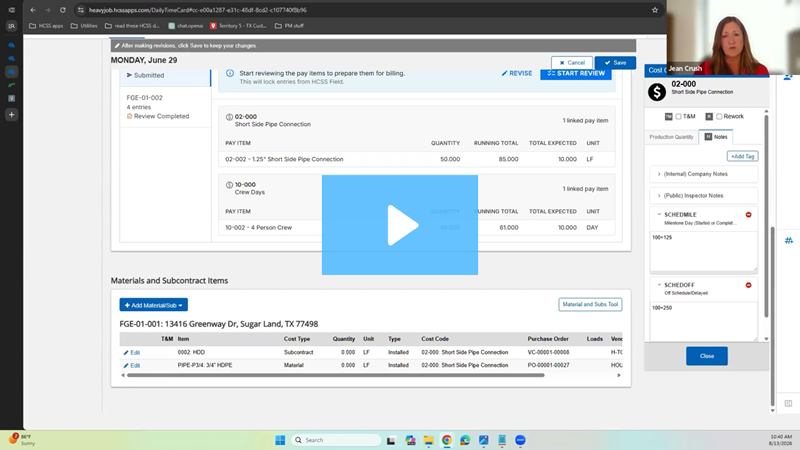
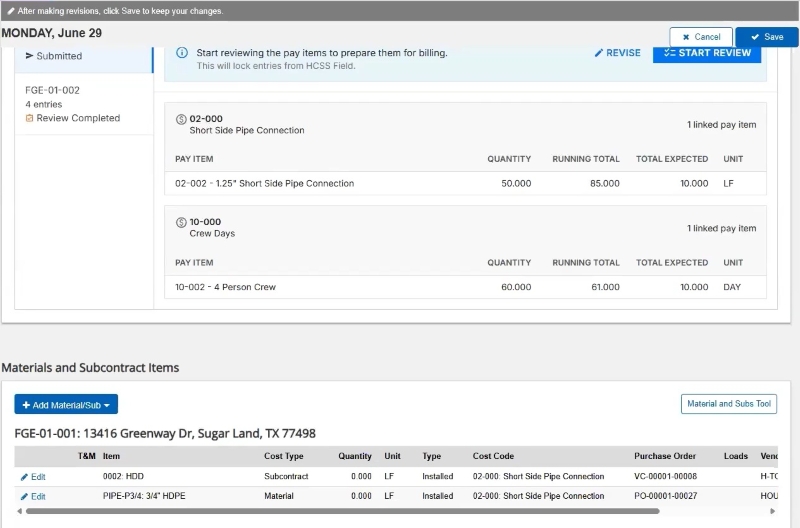
The same underlying platform also supports a second, very different workflow: unit-price distribution work. On these jobs, foremen pick their pay items directly in HeavyJob Web at the job site. That data, combined with field notes, manpower, and job photos, flows into Power BI and directly supports client invoicing, a workflow Price Gregory has run for over a year.
Building dashboards this detailed meant writing complex measures that went beyond Crush’s original training. That’s where AI entered the picture as a practical accelerant. Crush, who has an accounting background and no formal coding training, uses Claude to help translate what she sees in the HeavyJob data into working Power BI formulas. “If I had tried to do this about five years ago… I would have been researching some of these formulas for probably days,” she said. “Eight times out of ten, the first formula would give me what I need.”
The Outcome: Data Leadership Can Actually Trust
The shift to HeavyJob and Power BI closed the gap between what happened in the field and what showed up in a report. Corrections now flow through job-to-date totals instead of getting stranded in a spreadsheet tab. Leadership and clients can see linear-foot progress, weld counts by diameter, and rental costs in a dashboard that updates continuously, rather than a static file rebuilt tab by tab.
Crush can also adjust a Power BI measure on the fly when operations needs something new, using Claude to help her get there faster. And on the distribution side, the pay-item-to-invoicing workflow has made billing faster and cleaner, since the data supporting an invoice is already flowing from the field instead of being pieced together after the fact.
One of the more interesting side effects has been on data quality itself. When a Power BI report doesn’t tie out, questions now go back to the field crew that entered the data, not to Crush. “You’ve got to fix it at the field, that’s how people learn,” she said. That habit has made the underlying data more reliable over time, since crews are the ones fixing the root cause rather than the report.
Getting the Field on Board
None of this worked without buy-in from the people entering the data every day. Crush recalls a foreman on the pipeline job describing himself as “one of those old knuckle draggers,” a comment that captured the very real resistance to changing a process people had used for years. Getting past that resistance took visible support from the top: Price Gregory’s president backed the shift publicly and pushed the organization to move forward. Crush also spent several days on-site working directly alongside crews, which sent its own message that the change was serious and worth the effort.
That combination, executive backing plus in-field coaching, is what ultimately got the field on board. It’s also a reminder that a platform is only as good as the adoption behind it.
What’s Next for Price Gregory
Price Gregory is now rolling out HeavyJob Safety, with plans to bring that data into the same Power BI environment. It’s the next chapter in a broader shift: fewer manual processes, more connected data, and a platform flexible enough to grow with the way the company works.
“Technology is moving. It’s changing all the time,” Crush said. “You can’t stay stagnant.”